Normal blood pressure by age is the same for every adult: below 120/80 mm Hg, whether you are 25 or 75. What changes with age is the average reading, which climbs as arteries stiffen, so a chart of averages shows what is typical rather than what is healthy. This guide gives you the official categories, the average numbers by age and sex, and the habits that help you stay under 120/80.
The National Center for Health Statistics reports that 47.7% of U.S. adults had hypertension in 2021 to 2023, and only about one in five of them had it under control. Prevalence rises steeply with every decade, which is why knowing your category matters more than knowing the average for your age group.
Normal Blood Pressure Chart for Adults
The American Heart Association recognizes five ranges, shown below. The 2025 AHA and ACC high blood pressure guideline kept these same categories.
| Category | Reading (mm Hg) |
|---|---|
| Normal | Below 120 and below 80 |
| Elevated | 120 to 129 and below 80 |
| Stage 1 hypertension | 130 to 139 or 80 to 89 |
| Stage 2 hypertension | 140 or higher, or 90 or higher |
| Hypertensive crisis | Higher than 180 and/or higher than 120 |
The top number is systolic pressure, the force on your artery walls when your heart contracts. The bottom number is diastolic pressure, the force between beats. If your two numbers land in different categories, the higher category applies. A diagnosis also has to be confirmed by a medical professional, so one high reading is a reason to recheck, not a reason to panic.
If a reading ever exceeds 180/120, rest and test again after five minutes. According to the AHA guide to blood pressure readings, a reading that stays that high means you should contact your health care professional right away. If it comes with chest pain, shortness of breath, back pain, numbness or weakness, vision changes, or trouble speaking, call 911.
Jump to: Chart | Average by Age | How Common | Why It Rises | Children and Teens | Low Blood Pressure | Measure at Home | Food and Habits | FAQ
Average Blood Pressure by Age and Sex
No official chart sets a separate normal for each decade, but national survey data show what people typically measure. The table below comes from the National Health and Nutrition Examination Survey and lists average systolic and diastolic readings for U.S. adults. The first two columns include everyone. The last two include only adults who took no blood pressure medication and measured below 140/90.
| Age group | Men, all adults | Women, all adults | Men without hypertension | Women without hypertension |
|---|---|---|---|---|
| 18 to 39 | 119/70 | 110/68 | 117/68 | 109/67 |
| 40 to 59 | 124/77 | 122/74 | 119/74 | 115/72 |
| 60 and older | 133/69 | 139/68 | 121/67 | 122/66 |
These figures come from NCHS survey data for 2001 to 2008, so they are older than the current guideline, and the “without hypertension” columns used the old 140/90 cutoff. Some of those adults would fall in the Elevated or Stage 1 range today. Treat the table as a picture of how pressure behaves across life, not as a set of targets. Three patterns stand out:
- Systolic pressure climbs with age. The average for all adults rises from about 115 in the 18 to 39 group to 136 after 60, which sits in the Stage 2 range.
- Women overtake men after 60. Women start lower, at 110 versus 119, but average 139 after 60 compared with 133 for men.
- Diastolic pressure rises, then falls. It peaks in the 40s and 50s and drops after 60 as arteries stiffen, which is why systolic pressure gets more attention in older adults.
The last two columns tell the more hopeful story. Among adults without hypertension, the average systolic reading rises from 113 in the youngest group to 121 after 60, about 8 points. Among all adults it rises from 115 to 136, about 21 points. Most of the steep climb comes from people who develop high blood pressure, and that is the part you can influence.
How Common High Blood Pressure Is by Age
The same national survey program tracks how many adults cross the 130/80 line. Here the NCHS counts hypertension as a reading of 130/80 or higher, or use of blood pressure medication.
| Age group | All adults | Men | Women |
|---|---|---|---|
| 18 to 39 | 23.4% | 30.0% | 16.4% |
| 40 to 59 | 52.5% | 55.9% | 49.0% |
| 60 and older | 71.6% | 72.7% | 70.6% |
Men are more likely than women to have hypertension before 60, and the gap closes after that. Awareness is the other problem: only 27.2% of affected adults aged 18 to 39 knew they had it, compared with 73.7% of those 60 and older. Younger adults with a high reading often feel fine, so the number on the cuff is the only warning they get.
Why Blood Pressure Rises With Age
The AHA explains that systolic pressure rises steadily in most people because large arteries stiffen, plaque builds up over the years, and heart and vascular disease become more common. None of this makes a higher number acceptable. A reading of 140/90 at age 65 carries the same Stage 2 label it carries at age 35.
Several habits speed the climb or slow it. Carrying extra weight, eating more sodium than your body needs, drinking alcohol regularly, and sitting most of the day all push pressure up. Where you carry weight matters too, so it is worth checking your normal waist-to-hip ratio chart alongside your cuff readings.
Blood Pressure for Children and Teens
Age-specific charts do matter for young people. For children under 13, the 2017 American Academy of Pediatrics guideline defines hypertension as a reading at or above the 95th percentile for the child’s age, sex, and height, so a doctor has to interpret the number. For teens aged 13 and older, the guideline uses the adult cut points, including 130/80 for hypertension. If your child has a high home reading, bring it to a pediatrician instead of comparing it with the adult chart above.
What Counts as Low Blood Pressure
A reading below 90/60 is the usual cutoff for low blood pressure. The Mayo Clinic notes that most health professionals call it too low only when it causes symptoms. Dizziness, lightheadedness, fainting, blurred vision, and unusual fatigue are the signs to watch for, especially when your pressure drops suddenly or after standing up quickly. Many healthy, fit people sit comfortably in the low range for life. If low readings come with symptoms, or you take blood pressure medication, talk to your doctor before changing anything.
How to Measure Your Blood Pressure at Home
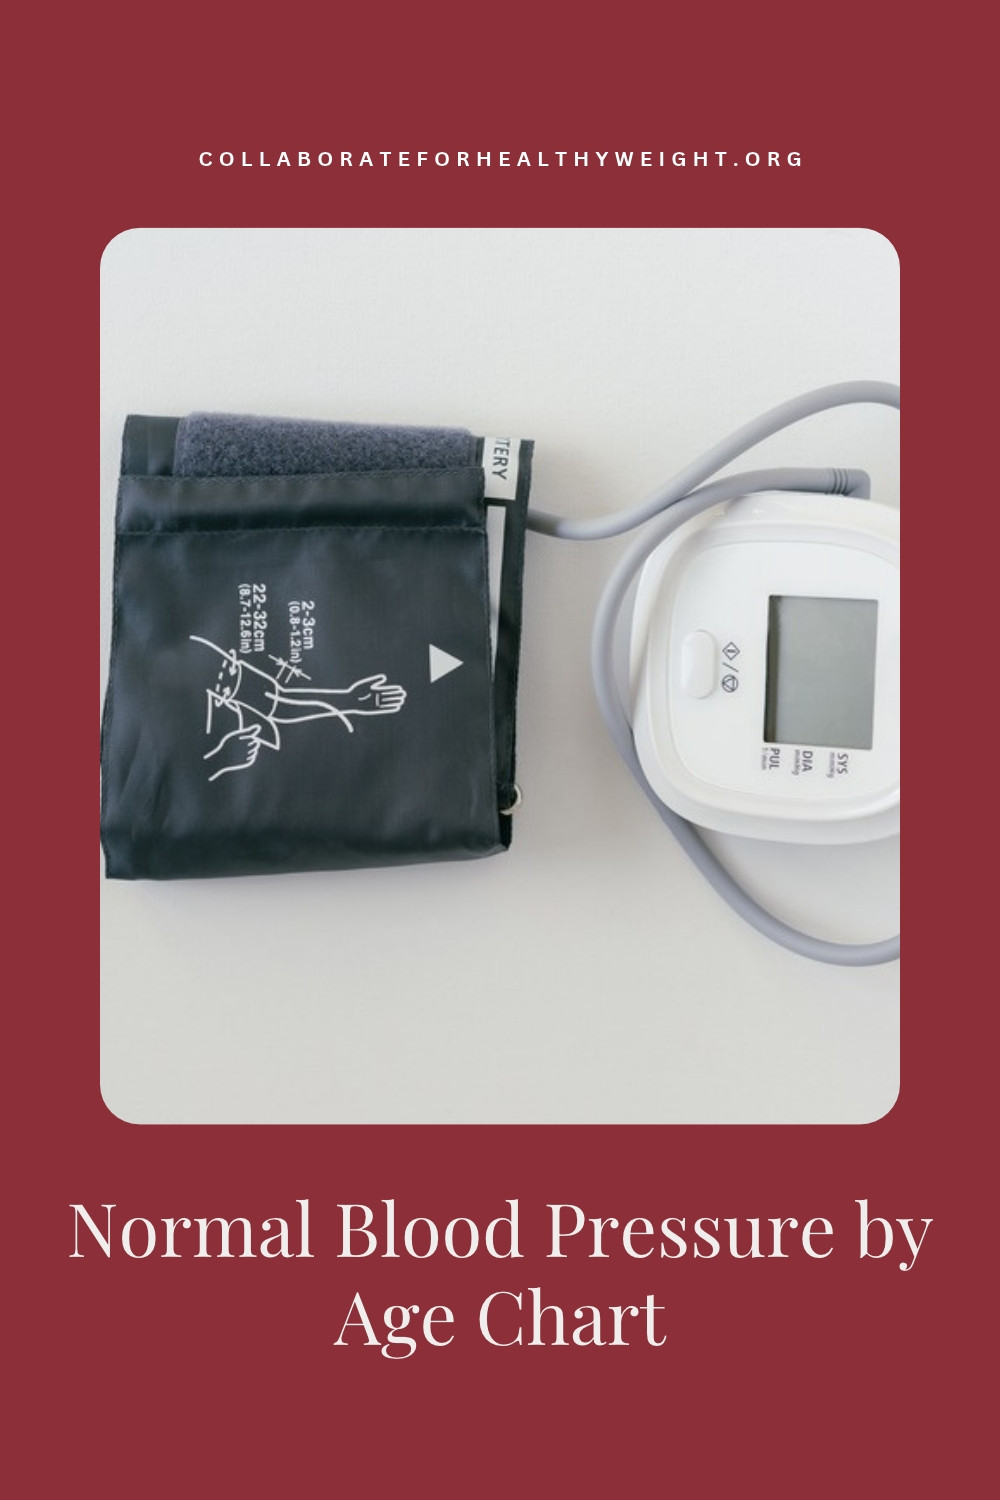
A reading is only as good as the way it was taken. Following the steps published by the AHA for home monitoring gives you numbers you can trust:
- Skip smoking, caffeine, alcohol, and exercise for 30 minutes before you measure.
- Sit in a chair with your back supported, feet flat on the floor, and legs uncrossed for five minutes.
- Use an automatic upper-arm monitor with a cuff that fits, placed on bare skin just above the elbow.
- Rest your arm on a table so the cuff sits at heart level, and stay quiet while the monitor runs.
- Wait one minute and take a second reading, then average the two.
- Write down the date, time, and numbers, and bring the log to your appointments.
The 2025 guideline also advises against relying on cuffless devices such as smartwatches for blood pressure readings until they prove more accurate. Blood pressure is one piece of your heart picture, so log it next to your normal cholesterol levels by age chart results and your normal resting heart rate by age range. For the LDL and HDL breakdown behind your cholesterol result, see the normal HDL and LDL levels chart.
Food and Habits That Help You Stay Under 120/80
Eating pattern is the most direct lever you control. The review of the DASH diet in StatPearls on managing hypertension through nutrition reports average systolic drops of 1 to 13 mm Hg on this eating plan, and cutting sodium from 2,300 mg to 1,500 mg a day lowers systolic pressure by roughly another 2 to 7 mm Hg. Pairing those changes with weight loss helps further, and the 2025 guideline advises adults with excess weight to aim for at least a 5% loss. You can build the pattern from the DASH diet food list or follow the 7-day high blood pressure diet meal plan.
Build most plates around these foods:
- Leafy greens such as spinach and kale
- Bananas, oranges, and other potassium-rich fruit
- Beans and lentils
- Unsalted nuts and seeds
- Oats and other whole grains
- Fish such as salmon and sardines
- Low-fat yogurt and milk
Most dietary sodium hides in packaged and restaurant food, not the salt shaker. The guide to foods that lower blood pressure and the list of foods to avoid for high blood pressure show what to add and what to swap, and the low sodium diet grocery list turns it into a shopping trip. If you have kidney disease or take medication that raises potassium, check with your doctor before increasing potassium-rich foods or using salt substitutes.
Frequently Asked Questions About Blood Pressure by Age
What is normal blood pressure by age?
For adults of every age, normal blood pressure is below 120/80 mm Hg. Average readings rise with age, but the category cutoffs do not change from your 20s to your 80s. Children and teens under 13 are judged by percentiles for age, sex, and height.
Is 130/80 normal for a 50-year-old?
No. A reading of 130/80 falls in the Stage 1 hypertension range at any adult age. It is common, since more than half of adults aged 40 to 59 are in that range or above, but common does not mean healthy. Repeat readings and a conversation with your doctor are the next step.
What is a good blood pressure for a 70-year-old?
The same categories apply, with under 120/80 as normal. Treatment targets for older adults can be adjusted by a doctor based on overall health, medications, and fall risk, so ask what goal fits you. Age alone does not make 150/90 normal.
Is normal blood pressure different for men and women?
The categories are identical for men and women. The averages differ: women tend to run lower before midlife, then average higher than men after 60, and men are more likely to have hypertension before age 60.
What blood pressure is too low?
A reading below 90/60 is generally considered low, but it only needs attention when it brings dizziness, fainting, or blurred vision, or when it drops suddenly from your usual numbers. Stay hydrated, stand up slowly, and tell your doctor if symptoms keep returning.
Can food really change your blood pressure?
Yes. The DASH eating plan and lower sodium intake both have trial evidence behind them, and combining them with weight loss and regular activity adds to the effect. Food will not replace medication when your doctor prescribes it, but it can lower the dose you need and keep elevated readings from becoming hypertension.
The Bottom Line
Normal blood pressure is below 120/80 at every adult age, even though averages drift upward over the decades. Use the category chart to judge your own numbers, measure at home with good technique, and treat Elevated or Stage 1 readings as an early signal to change your diet, sodium intake, weight, and activity. A few points off your systolic number can lower your long-term risk, and food is a practical place to start.
This article is for informational purposes only and is not a substitute for professional medical advice. Please consult your doctor to interpret your blood pressure readings and to decide on treatment.